There also seems to be growth at the bottom of the comic sales chart, a slight shift of 20 or so place for equivalent sales, which is a phenomenon I don't know that I've seen convincing analysis on, but I would imagine has to be encouraging.
Ask and ye shall receive, Tom!
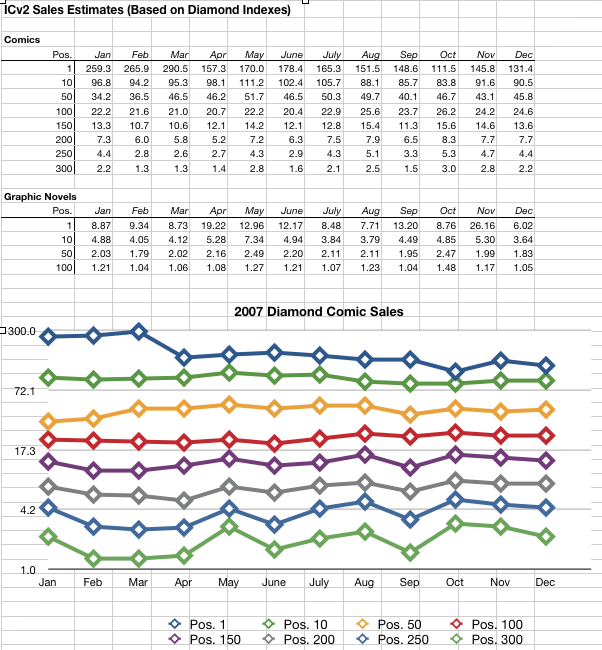
I looked at ICv2's Sales Estimates charts for all of 2007, grabbing the sales figures for positions 1, 10, 50, 100, 150, 200, 250, and 300. (I also did the graphic novel charts for positions 1, 10, 50, and 100.) Here's what we get:

(The Y-axis on the chart is on a logarithmic scale.)
The only thing that jumps out at me is that for comics, for every position but 50 & 1, the Jan 2007 numbers are darn close to the Dec 2007 numbers.
Frankly, I was expecting to see more connections. I thought that high numbers at the top would mean low numbers at the bottom, as the big selling titles would eat away at the mid and lower ranks. This is slightly true, as we can see that the highest numbers for 150, 200, 250 and 300 come in October, when positions 1 & 10 are at the lowest.
But every time I thought a pattern was emerging, along came a data set for the month which quashed the pattern.
(In case you're wondering, the big numbers at position 1 in the beginning of the year are from Civil War #s 6-7, then Captain America #25.)
As far as the graphic novel position data goes, it seems to be completely divorced from anything.
Does anyone else see anything different in the data?
(There is also no doubt a better analysis to be made, such as adding all top 10 slots and comparing to the total of the bottom 50 or something like that. This is just what I came up with for a quick look...)
1 comment:
This is a fascinating chart. It really drives home how stagnant direct market sales are.
I'd love to see a comparison that did include the top 10 sales positions.
Post a Comment